


1
Ensure your share of voice is strong enough to stand out

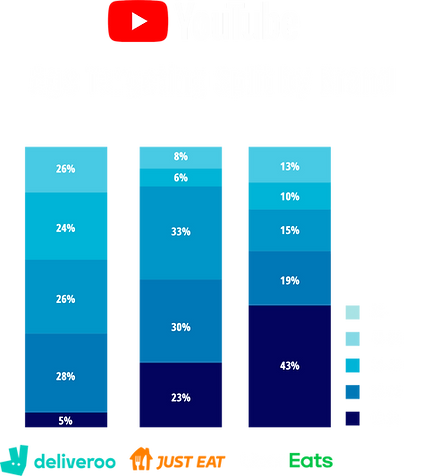
Know Your Share of Voice across YouTube, Facebook, Instagram, TikTok and TV
Understanding your Share of Voice (SOV) across advertising channels is critical to campaign success.
Traditionally, brands could rely on TV SOV as a reliable proxy for total media presence. But today, with TV no longer commanding the majority of ad spend, and with platforms like Google, Meta, and TikTok blocking third-party tracking, most brands have no accurate way to measure their true SOV.
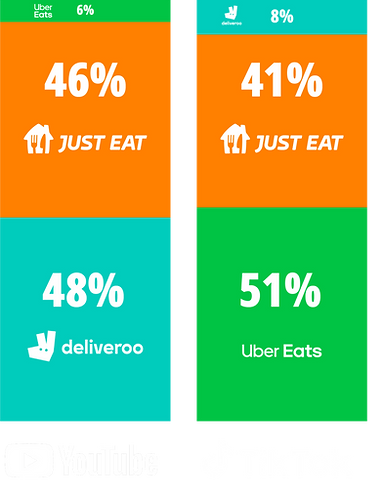
DELIVERY SECTOR - SOV
01
Apply the Excess Share of Voice (ESOV) strategy to drive brand growth - research consistently shows that ESOV is a key driver of market share gains.
GROW YOUR BRAND
02
Ensure your SOV is high enough to break through the noise.
MAKE AN IMPACT
03
Identify where competitors are under-investing, and avoid channels where competition is oversaturated.
COMPETITIVE ADVANTAGE
Know WHO your competitors are targeting
Understanding who your competitors are targeting online is a vital part of any marketing strategy.
By gaining insight into your competitors’ target audiences, you can:
01
IDENTIFY NEW SEGMENTS
Identify new customer segments that are highly relevant to your sector.
02
DEFEND OR WIN SHARE
See which competitors are targeting the same customers as you, and how to defend or win share.
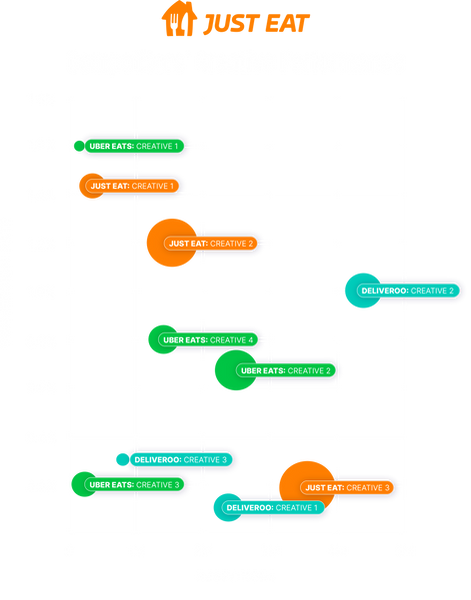
Know Which creatives your competitors are using
See which creatives your competitors are using across the walled gardens.
01
Get a clear view of the actual creatives your competitors are running and their targeting strategy
DETAILED OVERVIEW
02
See which creatives are delivering real outcomes.
MEASURE EFFECTIVENESS
03
React quickly and strategically to your competitors’ messaging
AGILE RESPONSE
Benchmark the performance of your campaign against your competitors
ViewersLogic operates a representative single-source panel of 10,000 UK consumers. We passively track individual-level ad exposure across TV, YouTube, TikTok, Facebook, and Instagram, alongside each person’s online and offline behaviour before and after exposure. This provides a complete, end-to-end view of the consumer journey.

How We Do It
Unique Technology + Unique Data = Unique Insights
ViewersLogic operates a representative single-source panel of 10,000 UK consumers. We passively track individual-level ad exposure across TV, YouTube, TikTok, Facebook, and Instagram, alongside each person’s online and offline behaviour before and after exposure. This provides a complete, end-to-end view of the consumer journey.
MEDIA EXPOSURE
10K
People Download and use our app

BEHAVIOURAL OUTCOMES
Site visits
Applications usage
In-app activity
Searches
Offline store visits
Online Purchases
Supermarket purchases
Driving greater marketing performance for CMOs at leading brands:
7%
22%
Increase in Sales
Increase in Website Visits
-15%
Cost Per Acquisition
Pricing
BASIC
£500 a month
billed annually
Campaign timelines – see exactly when your competitors ran ads on each channel
Targeting insights – understand who they were trying to reach
3 months of historical data for accurate benchmarking and trend analysis
Share of Voice across TV, YouTube, Facebook, TikTok, and Instagram
Professional
£1000 a month
billed annually
Everything in the BASIC package,
plus:
Detailed analysis of competitors’ creative execution and targeting strategy
Conversion rates for each creative
6 months of historical data for deeper insight and trend tracking
Premium
Everything in the PROFESSIONAL package,
plus:
Comprehensive analysis of your competitors’ campaigns
Measure uplift driven by each channel
Benchmark your campaign performance against industry competitors
Gain a detailed breakdown of what worked — and what didn’t — in their campaigns